


Trusted by over 15 Million Traders
The Most Awarded Broker
for a Reason
Easy Access to 1,400+ Global Assets
EURUSD
Euro vs U.S. Dollar
US500
S&P 500 (US500)
GOLD
Gold
COFFEE
US Coffee
Apple
Apple (AAPL.OQ)
-

Finance Magnates 颁发
-

Finance Magnates 颁发
-

Capital Finance International Magazine (CFI.co) 2024年颁赠
-

COLWMA 2024年颁赠
-

荣获World Finance Forex Awards 2023最佳外汇客户服务奖
-

荣获World Finance Forex Awards 2023欧洲最佳外汇经纪商奖
-

荣获World Finance Forex Awards 2023澳大拉西亚最佳外汇经纪商奖
-

荣获World Finance Forex Awards 2023拉丁美洲最佳外汇经纪商奖
-

荣获World Finance Forex Awards 2023中东最佳外汇经纪商奖
-

CFI.co于2023年颁赠
-

荣获2023年City of London Wealth Management Awards
-

荣获2022年埃及金融博览会颁赠
-

荣获2022年City of London Wealth Management Awards
-

CFI.co于2022年颁赠
-

荣获Global Forex Awards 2022 — 零售外汇 颁赠
-
2021年迪拜外汇博览会获颁赠
-

Ultimate Fintech 2021年颁赠
-

荣获2021年City of London Wealth Management Awards
-

FX168于2020年12月颁赠
-

荣获Global Business Awards 2020
-

荣获2020年City of London Wealth Management Awards
-

Capital Finance International Magazine (CFI.co)颁赠
-

Capital Finance International Magazine (CFI.co)颁赠
-

荣获2019年City of London Wealth Management Awards
-

Shares Magazine 授予 UK Forex Awards 2018
-

Capital Finance International Magazine (CFI.co)颁赠
-

Capital Finance International Magazine (CFI.co)颁赠
-

2017年伦敦财富管理奖
-

2016最佳本土 客户服务
-

中东和北非地区(MENA)增长最快的经纪商
-
2015年最佳外汇科技提供商
-
2014年最佳外汇科技提供商
-

2014年最佳外汇科技提供商
-

荣获 The Trading Show 2024年非洲 Africa Fintech 峰会颁赠
-

荣获2024年中东地区 Brokersview 颁赠
-
荣获2024年中东地区 Brokersview 颁赠
-

荣获2024年阿曼 Smart Vision 峰会颁赠
-

荣获2024年迪拜外汇博览会颁赠
-

荣获2024年迪拜 Forex Traders Summit 颁赠
-

2024年埃及 Smart Vision 峰会颁赠
-

投查查于2024年颁赠
-

Capital Finance International Magazine (CFI.co) 2024年颁赠
-

CFI.co于2023年颁赠
-

CFI.co于2023年颁赠
-

交易社区平台FOLLOWME于2022年颁赠
-
2022年迪拜Forex Expo获颁赠
-
2022年迪拜Forex Expo获颁赠
-

荣获Global Forex Awards 2022 — 零售外汇 颁赠
-

CFI.co于2022年颁赠
-

CFI.co于2022年颁赠
-

World Finance Forex Awards 2022 颁发
-

World Finance Forex Awards 2022 颁发
-

World Finance Forex Awards 2022 颁发
-

World Finance Forex Awards 2022 颁发
-
交易社区平台FOLLOWME于2021年颁赠
-

2021年埃及Smart Vision Investment Expo博览会获颁赠
-

CFI.co于2021年颁赠
-

CFI.co于2021年颁赠
-

荣获Global Forex Awards 2021 — 零售外汇 颁赠
-

荣获Global Forex Awards 2021 — 零售外汇 颁赠
-

World Finance 2021颁发
-

World Finance 2021颁发
-
FOLLOWME于2021年颁赠
-

Global Forex Awards 2021 — B2B 颁赠
-

Global Forex Awards颁赠
-

Global Forex Awards颁赠
-

CFI.co于2020年颁赠
-

CFI.co于2020年颁赠
-

荣获Global Business Awards 2020
-

World Finance Magazine 颁赠
World Finance Forex Awards 2020 -

World Finance Magazine 颁赠
World Finance Forex Awards 2020 -
FOLLOWME交易社区授予
-

Global Forex Awards颁赠
-

Global Forex Awards颁赠
-

FinTech Age Awards颁发
-

World Finance Magazine 颁赠
World Finance Forex Awards 2019 -

World Finance Magazine 颁赠
World Finance Forex Awards 2019 -

荣获 World Finance Forex Awards 2018 颁赠
-

荣获2018年埃及金融博览会颁赠
-

荣获 Shares Magazine 的 UK Forex Awards 2017 颁赠
-

荣获 World Finance Forex Awards 2017
-

2016年最佳黄金经纪商
-

2016年最佳外汇经纪商
-

2015年最佳本地客户服务
-

Global Brands Magazine 颁赠
-

Online Money Awards 2022 颁发
-

荣获2022年埃及金融博览会颁赠
-

2015最佳外汇交易平台
-

2015最佳金融交易平台
-

2013最佳创新外汇平台奖
-

2020年 Cyprus HR Awards 颁赠
-

金融行业的佼佼者
-

认证最优金牌级别
-

2014年首届亚军
-
Finance Magnates 颁发
-
Finance Magnates 颁发
-
Capital Finance International Magazine (CFI.co) 2024年颁赠
-
COLWMA 2024年颁赠
-
荣获World Finance Forex Awards 2023最佳外汇客户服务奖
-
荣获World Finance Forex Awards 2023欧洲最佳外汇经纪商奖
-
荣获World Finance Forex Awards 2023澳大拉西亚最佳外汇经纪商奖
-
荣获World Finance Forex Awards 2023拉丁美洲最佳外汇经纪商奖
-
荣获World Finance Forex Awards 2023中东最佳外汇经纪商奖
-
CFI.co于2023年颁赠
-
荣获2023年City of London Wealth Management Awards
-
荣获2022年埃及金融博览会颁赠
-
荣获2022年City of London Wealth Management Awards
-
CFI.co于2022年颁赠
-
荣获Global Forex Awards 2022 — 零售外汇 颁赠
-
2021年迪拜外汇博览会获颁赠
-
Ultimate Fintech 2021年颁赠
-
荣获2021年City of London Wealth Management Awards
-
FX168于2020年12月颁赠
-
荣获Global Business Awards 2020
-
荣获2020年City of London Wealth Management Awards
-
Capital Finance International Magazine (CFI.co)颁赠
-
Capital Finance International Magazine (CFI.co)颁赠
-
荣获2019年City of London Wealth Management Awards
-
Shares Magazine 授予 UK Forex Awards 2018
-
Capital Finance International Magazine (CFI.co)颁赠
-
Capital Finance International Magazine (CFI.co)颁赠
-
2017年伦敦财富管理奖
-
2016最佳本土 客户服务
-
中东和北非地区(MENA)增长最快的经纪商
-
2015年最佳外汇科技提供商
-
2014年最佳外汇科技提供商
-
2014年最佳外汇科技提供商
-
荣获 The Trading Show 2024年非洲 Africa Fintech 峰会颁赠
-
荣获2024年中东地区 Brokersview 颁赠
-
荣获2024年中东地区 Brokersview 颁赠
-
荣获2024年阿曼 Smart Vision 峰会颁赠
-
荣获2024年迪拜外汇博览会颁赠
-
荣获2024年迪拜 Forex Traders Summit 颁赠
-
2024年埃及 Smart Vision 峰会颁赠
-
投查查于2024年颁赠
-
Capital Finance International Magazine (CFI.co) 2024年颁赠
-
CFI.co于2023年颁赠
-
CFI.co于2023年颁赠
-
交易社区平台FOLLOWME于2022年颁赠
-
2022年迪拜Forex Expo获颁赠
-
2022年迪拜Forex Expo获颁赠
-
荣获Global Forex Awards 2022 — 零售外汇 颁赠
-
CFI.co于2022年颁赠
-
CFI.co于2022年颁赠
-
World Finance Forex Awards 2022 颁发
-
World Finance Forex Awards 2022 颁发
-
World Finance Forex Awards 2022 颁发
-
World Finance Forex Awards 2022 颁发
-
交易社区平台FOLLOWME于2021年颁赠
-
2021年埃及Smart Vision Investment Expo博览会获颁赠
-
CFI.co于2021年颁赠
-
CFI.co于2021年颁赠
-
荣获Global Forex Awards 2021 — 零售外汇 颁赠
-
荣获Global Forex Awards 2021 — 零售外汇 颁赠
-
World Finance 2021颁发
-
World Finance 2021颁发
-
FOLLOWME于2021年颁赠
-
Global Forex Awards 2021 — B2B 颁赠
-
Global Forex Awards颁赠
-
Global Forex Awards颁赠
-
CFI.co于2020年颁赠
-
CFI.co于2020年颁赠
-
荣获Global Business Awards 2020
-
World Finance Magazine 颁赠
World Finance Forex Awards 2020 -
World Finance Magazine 颁赠
World Finance Forex Awards 2020 -
FOLLOWME交易社区授予
-
Global Forex Awards颁赠
-
Global Forex Awards颁赠
-
FinTech Age Awards颁发
-
World Finance Magazine 颁赠
World Finance Forex Awards 2019 -
World Finance Magazine 颁赠
World Finance Forex Awards 2019 -
荣获 World Finance Forex Awards 2018 颁赠
-
荣获2018年埃及金融博览会颁赠
-
荣获 Shares Magazine 的 UK Forex Awards 2017 颁赠
-
荣获 World Finance Forex Awards 2017
-
2016年最佳黄金经纪商
-
2016年最佳外汇经纪商
-
2015年最佳本地客户服务
-
Global Brands Magazine 颁赠
-
Online Money Awards 2022 颁发
-
荣获2022年埃及金融博览会颁赠
-
2015最佳外汇交易平台
-
2015最佳金融交易平台
-
2013最佳创新外汇平台奖
-
2020年 Cyprus HR Awards 颁赠
-
金融行业的佼佼者
-
认证最优金牌级别
-
2014年首届亚军

Awarded BestBrokerYear After Year
CATEGORIES
News
- 【XM Group】--EUR/USD Forecast: Looking for a Breakout
- 【XM Decision Analysis】--BTC/USD Forecast: Bitcoin Rallies Significantly on Frida
- 【XM Decision Analysis】--AUD/USD Forex Signal: Forecast Ahead of Fed Decision, Au
- 【XM Decision Analysis】--EUR/USD Forecast: Euro Struggles Below 1.06
- 【XM Market Review】--USD/CAD Forecast: Eyes Breakout Above 1.45
market news
The daily line is connected to the gate, and gold and silver are often asked for the tripod
Wonderful Introduction:
Green life is full of hope, beautiful fantasy, hope for the future, and the ideal of longing is the green of life. The road we are going tomorrow is green, just like the grass on the wilderness, releasing the vitality of life.
Hello everyone, today XM Foreign Exchange will bring you "[XM Foreign Exchange Official Website]: Daily line is connected to the pass, and gold and silver are facing the top more". Hope it will be helpful to you! The original content is as follows:
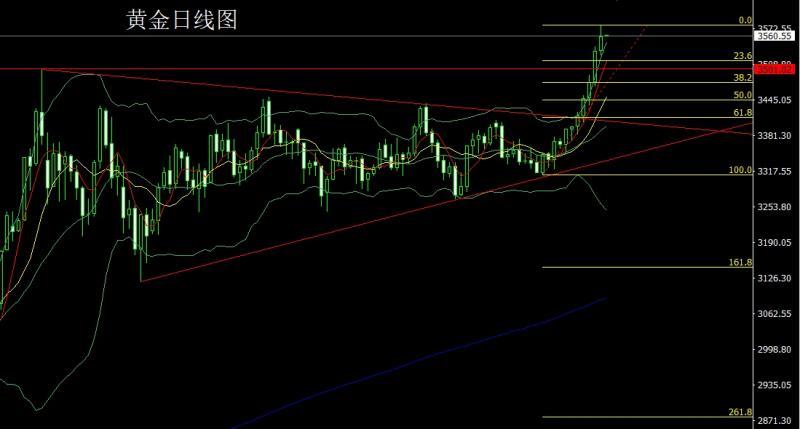
Yesterday, the gold market opened at 3533.8 in the morning and then rose slightly. The market fluctuated and fell. The daily line was at the lowest point of 3525.7 and then the market was consolidated. The US market broke through the pressure of 3550 and reached the highest point of 3578.6 and then the market consolidated. The daily line finally closed at 3559.1 and then closed with a large positive line with a long upper shadow line. After this pattern ended, today's market There is still a long demand. At the point, the long 3325 and 3322 below are the long 3368-3370 last week and the long 3377 and 3385 long 3385 after reducing positions, and the stop loss followed at 3450. The early trading today first pulled up and gave 3573 short 3575 short 3579 below look at 3560 and 3550-3545 left the market, and the bottom gave 3543-3540 long stop loss 3536, and the target was 3580 and 3592 and 3600-3612.
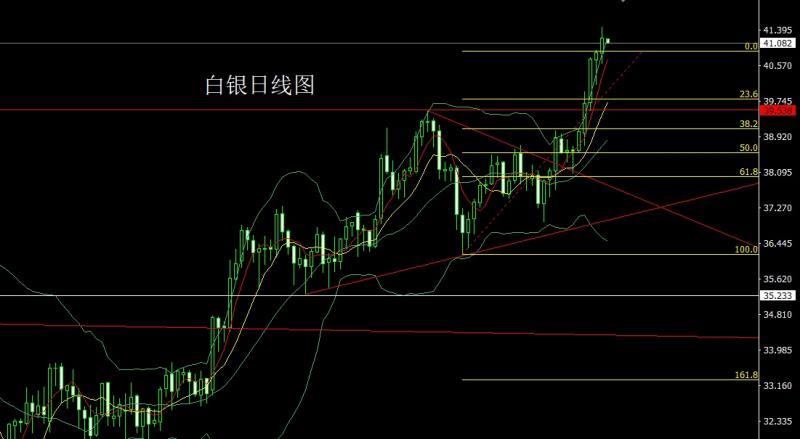
The silver market opened at 40.845 yesterday and the market fell first. The daily line was at the lowest point of 40.608 and then the market fluctuated and rose. The daily line reached the highest point of 41.466 and then the market consolidated. After the daily line finally closed at 41.202, the daily line closed with a medium-positive line with an upper and lower shadow line. After this pattern ended, the 37.8 bottom was bullish and 38.8 last FridayThe stop loss following after reducing positions was held at 39.5, the stop loss following after reducing positions was 40.4, the stop loss following after reducing positions was 40.4, today's 40.8 is 40.6, the target is 41.2 and 41.5, and if the break is 41.8 and 42-42.3.
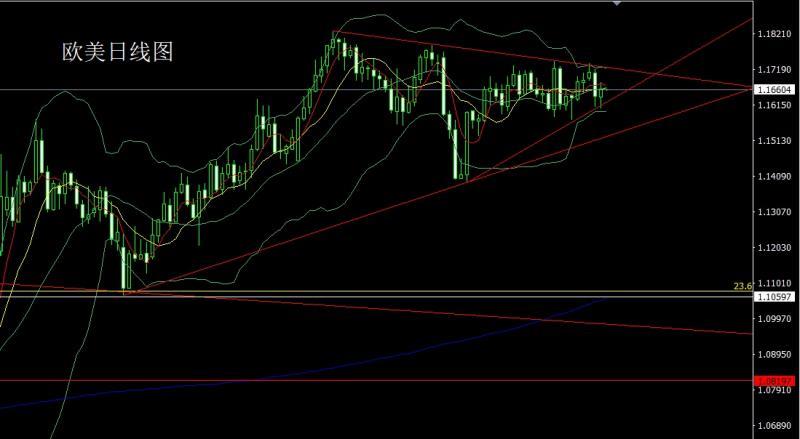
European and American markets opened at 1.16393 yesterday and the market fell first. The daily line was at the lowest point of 1.16073. After the market was supported by this round of short-term upward trend line, the daily line reached the highest point of 1.16819 and the market consolidated. After the daily line finally closed at 1.16609, the daily line closed in a spindle pattern with a lower shadow line slightly longer than the upper shadow line. After this pattern ended, the stop loss of 1.16300 is more than 1.16100 today, and the target is 1.16600 and 1.16800 and 1.17000-1.17200.
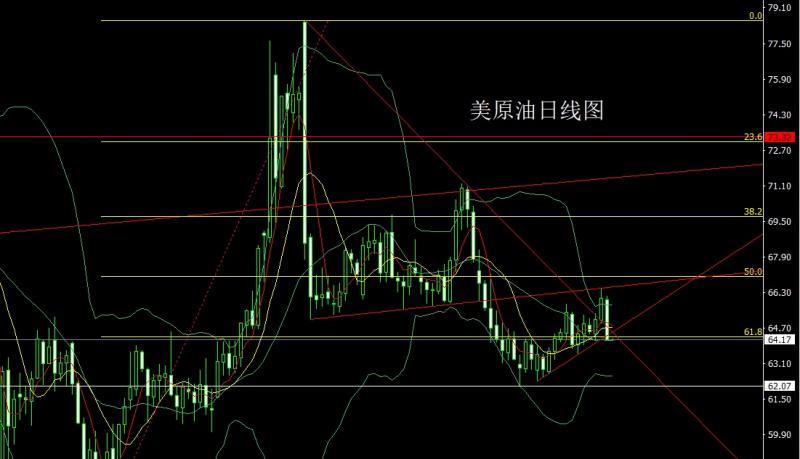
The US crude oil market fell under fundamental pressure yesterday. After the opening at 65.98 in the morning, the market first rose and gave the position of 66.13. The market fluctuated strongly. The daily line was at the lowest point of 64.12 and then the market consolidated. After the daily line finally closed at 64.17, the daily line closed with a saturated large negative line with a slightly longer upper shadow line. After this pattern ended, the short stop loss of 65.2 today at 64.7. The target below is 64.1 and 63.5 and 63.
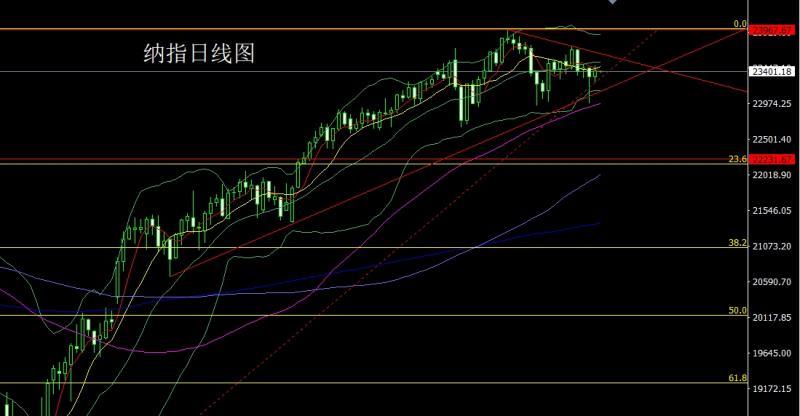
Nasdaq market opened at 23331.34 yesterday and the market fell first. The daily line was at the lowest point of 23251.18, and the market fluctuated and rose. The daily line reached the highest point of 23482.96. After the market consolidated. The daily line finally closed at 23410.53. After the market closed with a spindle with an upper and lower shadow line. After this pattern ended, today's technically still looked at the long demand. At the point, the stop loss of 23320 is more than 23270, and the target is 23400 and 23480 and 23520 and 23580-23600.
Fundamentals, yesterday's fundamentals. Many Federal Reserve officials said on Wednesday that the concerns in the labor market are still the main reason why they believe that the Fed will cut interest rates in the future. The Federal Reserve Beige Book: Economic activities are basically flat, and businesses and households feel the impact of tariffs. Therefore, during the US session, the US index rose and fell, and the gold and silver market rose strongly. Today's fundamentals mainly focus on the number of American ADP employment in August at 20:15. Look at the number of initial unemployment claims and the U.S. trade accounts for July from 20:30 to the week of August 30. Watch the US August S&P Global Service at 21:45 a little laterFinal value of industry PMI. Then look at the US August ISM Non-Manufacturing PMI at 22:00. Tomorrow morning, we will pay attention to the EIA crude oil inventories from the US to August 29th week and the EIA Cushing crude oil inventories from the US to August 29th week and the EIA strategic oil reserve inventories from the US to August 29th week.
In terms of operation, gold: the longs of 3325 and 3322 below and the longs of 3368-3370 last week and the longs of 3377 and 3385 after reducing positions, the stop loss followed at 3450. The early trading today first pulled up and gave 3573 shorts conservative 3575 shorts stop loss 3579. The bottom looks at 3560 and 3550-3545 leaving the market, and the bottom gives 3543-3540 today Long stop loss 3536, target 3580 and 3592 and 3600-3612.
Silver: The long 37.8 below and the long 38.8 last Friday, after reducing positions, the stop loss followed at 39.5, the long 40.3 day before yesterday, the stop loss followed at 40.4, today 40.8 long stop loss 40.6, target 41.2 and 41.5, if the break is 41.8 and 42-42.3.
Europe and the United States: 1.16300 more stop loss today 1.16100, target 1.16600 and 1.16800 and 1.17000-1.17200.
U.S. crude oil: 64.7 short stop loss today 65.2, target below 64.1 and 63.5 and 63.
Nasdaq: 23320 more stop loss today 23270, target 23400 and 23480 and 23520 and 23580-23600.
The above content is all about "[XM Foreign Exchange Official Website]: Daily line is continuous and positive, and gold and silver are facing the top more", which is carefully www.xmniubi.compiled and edited by the editor of XM Foreign Exchange. I hope it will be helpful to your trading! Thanks for the support!
Only the strong know how to fight; the weak are not qualified to fail, but are born to be conquered. Step up to learn the next article!
Disclaimers: XM Group only provides execution services and access permissions for online trading platforms, and allows individuals to view and/or use the website or the content provided on the website, but has no intention of making any changes or extensions, nor will it change or extend its services and access permissions. All access and usage permissions will be subject to the following terms and conditions: (i) Terms and conditions; (ii) Risk warning; And (iii) a complete disclaimer. Please note that all information provided on the website is for general informational purposes only. In addition, the content of all XM online trading platforms does not constitute, and cannot be used for any unauthorized financial market trading invitations and/or invitations. Financial market transactions pose significant risks to your investment capital.
All materials published on online trading platforms are only intended for educational/informational purposes and do not include or should be considered for financial, investment tax, or trading related consulting and advice, or transaction price records, or any financial product or non invitation related trading offers or invitations.
All content provided by XM and third-party suppliers on this website, including opinions, news, research, analysis, prices, other information, and third-party website links, remains unchanged and is provided as general market commentary rather than investment advice. All materials published on online trading platforms are only for educational/informational purposes and do not include or should be considered as applicable to financial, investment tax, or trading related advice and recommendations, or transaction price records, or any financial product or non invitation related financial offers or invitations. Please ensure that you have read and fully understood the information on XM's non independent investment research tips and risk warnings. For more details, please click here