


Trusted by over 15 Million Traders
The Most Awarded Broker
for a Reason
Easy Access to 1,400+ Global Assets
EURUSD
Euro vs U.S. Dollar
US500
S&P 500 (US500)
GOLD
Gold
COFFEE
US Coffee
Apple
Apple (AAPL.OQ)
-

Finance Magnates 颁发
-

Finance Magnates 颁发
-

Capital Finance International Magazine (CFI.co) 2024年颁赠
-

COLWMA 2024年颁赠
-

荣获World Finance Forex Awards 2023最佳外汇客户服务奖
-

荣获World Finance Forex Awards 2023欧洲最佳外汇经纪商奖
-

荣获World Finance Forex Awards 2023澳大拉西亚最佳外汇经纪商奖
-

荣获World Finance Forex Awards 2023拉丁美洲最佳外汇经纪商奖
-

荣获World Finance Forex Awards 2023中东最佳外汇经纪商奖
-

CFI.co于2023年颁赠
-

荣获2023年City of London Wealth Management Awards
-

荣获2022年埃及金融博览会颁赠
-

荣获2022年City of London Wealth Management Awards
-

CFI.co于2022年颁赠
-

荣获Global Forex Awards 2022 — 零售外汇 颁赠
-
2021年迪拜外汇博览会获颁赠
-

Ultimate Fintech 2021年颁赠
-

荣获2021年City of London Wealth Management Awards
-

FX168于2020年12月颁赠
-

荣获Global Business Awards 2020
-

荣获2020年City of London Wealth Management Awards
-

Capital Finance International Magazine (CFI.co)颁赠
-

Capital Finance International Magazine (CFI.co)颁赠
-

荣获2019年City of London Wealth Management Awards
-

Shares Magazine 授予 UK Forex Awards 2018
-

Capital Finance International Magazine (CFI.co)颁赠
-

Capital Finance International Magazine (CFI.co)颁赠
-

2017年伦敦财富管理奖
-

2016最佳本土 客户服务
-

中东和北非地区(MENA)增长最快的经纪商
-
2015年最佳外汇科技提供商
-
2014年最佳外汇科技提供商
-

2014年最佳外汇科技提供商
-

荣获 The Trading Show 2024年非洲 Africa Fintech 峰会颁赠
-

荣获2024年中东地区 Brokersview 颁赠
-
荣获2024年中东地区 Brokersview 颁赠
-

荣获2024年阿曼 Smart Vision 峰会颁赠
-

荣获2024年迪拜外汇博览会颁赠
-

荣获2024年迪拜 Forex Traders Summit 颁赠
-

2024年埃及 Smart Vision 峰会颁赠
-

投查查于2024年颁赠
-

Capital Finance International Magazine (CFI.co) 2024年颁赠
-

CFI.co于2023年颁赠
-

CFI.co于2023年颁赠
-

交易社区平台FOLLOWME于2022年颁赠
-
2022年迪拜Forex Expo获颁赠
-
2022年迪拜Forex Expo获颁赠
-

荣获Global Forex Awards 2022 — 零售外汇 颁赠
-

CFI.co于2022年颁赠
-

CFI.co于2022年颁赠
-

World Finance Forex Awards 2022 颁发
-

World Finance Forex Awards 2022 颁发
-

World Finance Forex Awards 2022 颁发
-

World Finance Forex Awards 2022 颁发
-
交易社区平台FOLLOWME于2021年颁赠
-

2021年埃及Smart Vision Investment Expo博览会获颁赠
-

CFI.co于2021年颁赠
-

CFI.co于2021年颁赠
-

荣获Global Forex Awards 2021 — 零售外汇 颁赠
-

荣获Global Forex Awards 2021 — 零售外汇 颁赠
-

World Finance 2021颁发
-

World Finance 2021颁发
-
FOLLOWME于2021年颁赠
-

Global Forex Awards 2021 — B2B 颁赠
-

Global Forex Awards颁赠
-

Global Forex Awards颁赠
-

CFI.co于2020年颁赠
-

CFI.co于2020年颁赠
-

荣获Global Business Awards 2020
-

World Finance Magazine 颁赠
World Finance Forex Awards 2020 -

World Finance Magazine 颁赠
World Finance Forex Awards 2020 -
FOLLOWME交易社区授予
-

Global Forex Awards颁赠
-

Global Forex Awards颁赠
-

FinTech Age Awards颁发
-

World Finance Magazine 颁赠
World Finance Forex Awards 2019 -

World Finance Magazine 颁赠
World Finance Forex Awards 2019 -

荣获 World Finance Forex Awards 2018 颁赠
-

荣获2018年埃及金融博览会颁赠
-

荣获 Shares Magazine 的 UK Forex Awards 2017 颁赠
-

荣获 World Finance Forex Awards 2017
-

2016年最佳黄金经纪商
-

2016年最佳外汇经纪商
-

2015年最佳本地客户服务
-

Global Brands Magazine 颁赠
-

Online Money Awards 2022 颁发
-

荣获2022年埃及金融博览会颁赠
-

2015最佳外汇交易平台
-

2015最佳金融交易平台
-

2013最佳创新外汇平台奖
-

2020年 Cyprus HR Awards 颁赠
-

金融行业的佼佼者
-

认证最优金牌级别
-

2014年首届亚军
-
Finance Magnates 颁发
-
Finance Magnates 颁发
-
Capital Finance International Magazine (CFI.co) 2024年颁赠
-
COLWMA 2024年颁赠
-
荣获World Finance Forex Awards 2023最佳外汇客户服务奖
-
荣获World Finance Forex Awards 2023欧洲最佳外汇经纪商奖
-
荣获World Finance Forex Awards 2023澳大拉西亚最佳外汇经纪商奖
-
荣获World Finance Forex Awards 2023拉丁美洲最佳外汇经纪商奖
-
荣获World Finance Forex Awards 2023中东最佳外汇经纪商奖
-
CFI.co于2023年颁赠
-
荣获2023年City of London Wealth Management Awards
-
荣获2022年埃及金融博览会颁赠
-
荣获2022年City of London Wealth Management Awards
-
CFI.co于2022年颁赠
-
荣获Global Forex Awards 2022 — 零售外汇 颁赠
-
2021年迪拜外汇博览会获颁赠
-
Ultimate Fintech 2021年颁赠
-
荣获2021年City of London Wealth Management Awards
-
FX168于2020年12月颁赠
-
荣获Global Business Awards 2020
-
荣获2020年City of London Wealth Management Awards
-
Capital Finance International Magazine (CFI.co)颁赠
-
Capital Finance International Magazine (CFI.co)颁赠
-
荣获2019年City of London Wealth Management Awards
-
Shares Magazine 授予 UK Forex Awards 2018
-
Capital Finance International Magazine (CFI.co)颁赠
-
Capital Finance International Magazine (CFI.co)颁赠
-
2017年伦敦财富管理奖
-
2016最佳本土 客户服务
-
中东和北非地区(MENA)增长最快的经纪商
-
2015年最佳外汇科技提供商
-
2014年最佳外汇科技提供商
-
2014年最佳外汇科技提供商
-
荣获 The Trading Show 2024年非洲 Africa Fintech 峰会颁赠
-
荣获2024年中东地区 Brokersview 颁赠
-
荣获2024年中东地区 Brokersview 颁赠
-
荣获2024年阿曼 Smart Vision 峰会颁赠
-
荣获2024年迪拜外汇博览会颁赠
-
荣获2024年迪拜 Forex Traders Summit 颁赠
-
2024年埃及 Smart Vision 峰会颁赠
-
投查查于2024年颁赠
-
Capital Finance International Magazine (CFI.co) 2024年颁赠
-
CFI.co于2023年颁赠
-
CFI.co于2023年颁赠
-
交易社区平台FOLLOWME于2022年颁赠
-
2022年迪拜Forex Expo获颁赠
-
2022年迪拜Forex Expo获颁赠
-
荣获Global Forex Awards 2022 — 零售外汇 颁赠
-
CFI.co于2022年颁赠
-
CFI.co于2022年颁赠
-
World Finance Forex Awards 2022 颁发
-
World Finance Forex Awards 2022 颁发
-
World Finance Forex Awards 2022 颁发
-
World Finance Forex Awards 2022 颁发
-
交易社区平台FOLLOWME于2021年颁赠
-
2021年埃及Smart Vision Investment Expo博览会获颁赠
-
CFI.co于2021年颁赠
-
CFI.co于2021年颁赠
-
荣获Global Forex Awards 2021 — 零售外汇 颁赠
-
荣获Global Forex Awards 2021 — 零售外汇 颁赠
-
World Finance 2021颁发
-
World Finance 2021颁发
-
FOLLOWME于2021年颁赠
-
Global Forex Awards 2021 — B2B 颁赠
-
Global Forex Awards颁赠
-
Global Forex Awards颁赠
-
CFI.co于2020年颁赠
-
CFI.co于2020年颁赠
-
荣获Global Business Awards 2020
-
World Finance Magazine 颁赠
World Finance Forex Awards 2020 -
World Finance Magazine 颁赠
World Finance Forex Awards 2020 -
FOLLOWME交易社区授予
-
Global Forex Awards颁赠
-
Global Forex Awards颁赠
-
FinTech Age Awards颁发
-
World Finance Magazine 颁赠
World Finance Forex Awards 2019 -
World Finance Magazine 颁赠
World Finance Forex Awards 2019 -
荣获 World Finance Forex Awards 2018 颁赠
-
荣获2018年埃及金融博览会颁赠
-
荣获 Shares Magazine 的 UK Forex Awards 2017 颁赠
-
荣获 World Finance Forex Awards 2017
-
2016年最佳黄金经纪商
-
2016年最佳外汇经纪商
-
2015年最佳本地客户服务
-
Global Brands Magazine 颁赠
-
Online Money Awards 2022 颁发
-
荣获2022年埃及金融博览会颁赠
-
2015最佳外汇交易平台
-
2015最佳金融交易平台
-
2013最佳创新外汇平台奖
-
2020年 Cyprus HR Awards 颁赠
-
金融行业的佼佼者
-
认证最优金牌级别
-
2014年首届亚军

Awarded BestBrokerYear After Year
CATEGORIES
News
- 【XM Market Analysis】--EUR/CHF Forecast: Finds Support at 0.92
- 【XM Forex】--USD/MYR Forecast: US Dollar Pressing a Major Barrier Against Ringgit
- 【XM Decision Analysis】--GBP/USD Forecast: Tests Key Resistance
- 【XM Market Review】--S&P 500 Monthly Forecast: December 2024
- 【XM Forex】--Silver Forecast: Silver Struggles at $31 Resistance, Stuck in a Rang
market news
Big yellow croaker jumps over the dragon gate, gold and silver break through and continue to continue
Wonderful introduction:
Don't learn to be sad in the years of youth, what www.xmniubi.comes and goes cannot withstand the passing time. What I promise you may not be the end of the world. Do you remember that the ice blue that has not been asleep in the night is like the romance swallowed by purple jasmine, but the road is far away and people have not returned, where can the love be lost?
Hello everyone, today XM Foreign Exchange will bring you "[XM Foreign Exchange Official Website]: Big yellow croaker jumps over the dragon gate, and gold and silver break through the level continue to be more". Hope it will be helpful to you! The original content is as follows:
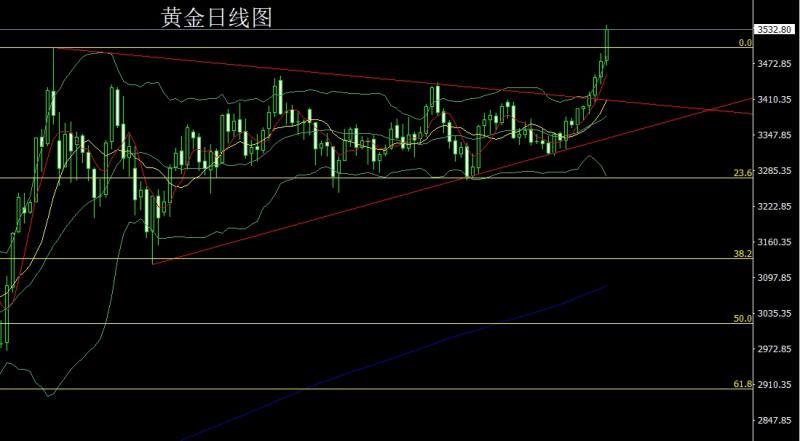
Yesterday, the gold market opened at 3478.3 in the morning and then the market first rose and broke through the historical high of 3500 and then reached the position of 3509.2. The market fell in the short-term profit. The daily line was at the lowest level of 3469.7. After the US market was pushed up by fundamentals during the trading session. The market rose strongly. After the daily line broke through the historical high again, it reached the historical high of 3540.6 and then the market consolidated. The daily line finally closed at 3532.6 and the market was equal to the upper and lower shadow line. The big positive line closes, and after such a pattern ends, the daily line effectively breaks at 3500 height, and the daily line www.xmniubi.completes the N-word break. Today's market rebound continues to be long. At the point, the long 3325 and 3322 below are long and long 3368-3370 last week's long and 3377 and 3385 long and the stop loss follow up at 3420. Today's 3512 long and 3509 long stop loss 3505, the target is 3532 and 3541, and the break is 3550 and 3562-3573.
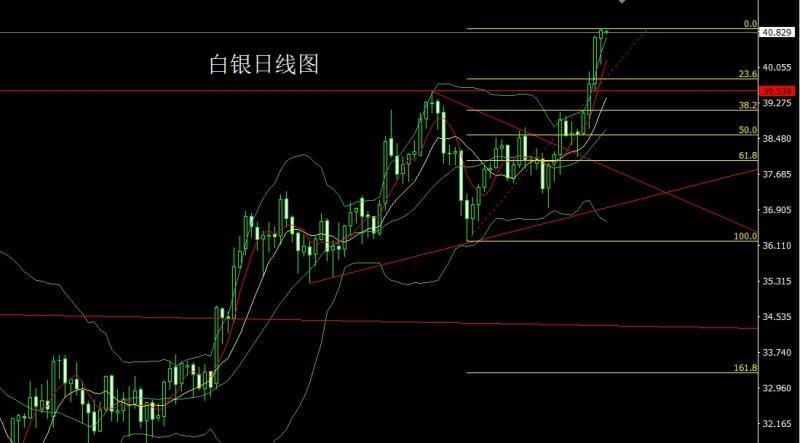
The silver market opened at 40.702 yesterday and then the market first rose. The market fluctuated and fell. The daily line was at the lowest point of 40.122 and then rose strongly at the end of the trading session. The daily line reached the highest point of 40.915 and then the market consolidated. After the daily line finally closed at 40.874, the daily line closed in a hammer head with an extremely long lower shadow line., and after this pattern ended, the retracement today continued to be long. At the point, the long at 37.8 below and the long at 38.8 last Friday, the stop loss followed by the 39.5 holdings, the stop loss followed by the 40.3 losing position yesterday, and the stop loss followed by the 40.3 holdings, and today, the stop loss was 40.3. The target is 41 and 41.2 and 41.5-41.7.
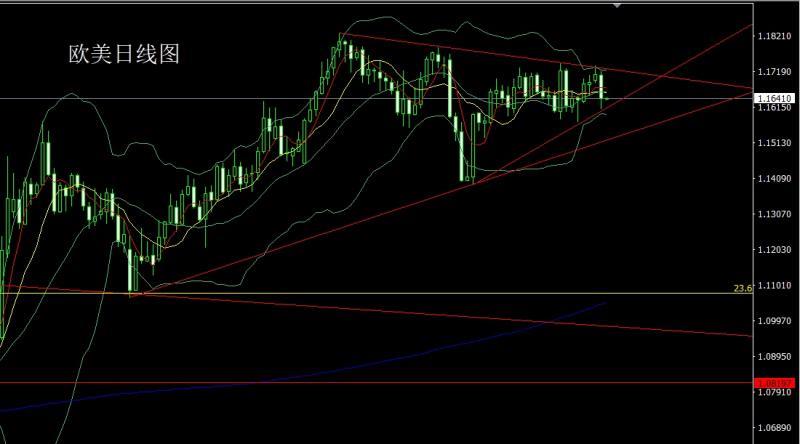
European and American markets opened at 1.17086 yesterday and the market rose slightly, giving a position of 1.17180. The market fell under pressure and fell strongly. The daily line was at the lowest level of 1.16118. The market finally closed at 1.16413. The market closed with a large negative line with a long lower shadow line. After this pattern ended, today's short stop loss of 1.17000. The target below is 1.16400 and 1.16100. If it falls below, it looks at 1.15800 and 1.15600.
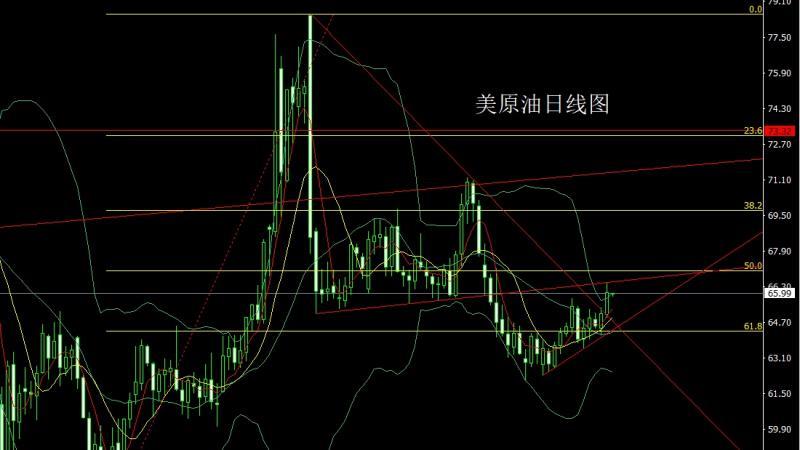
The US crude oil market opened at 65.04 yesterday and then fell back first. The market rose strongly. The daily line reached the highest position of 66.46 and then the market fell strongly during the session. The daily line was at the lowest position of 64.91 and then rose twice in the late trading. The daily line finally closed at 66.04 and then closed with a large positive line with a long upper shadow line. After this pattern ended, today's market fell back long. At the point, today's 65.4 long stop loss 64.9, and the target is 66 and 66.5 and 67-67.5.
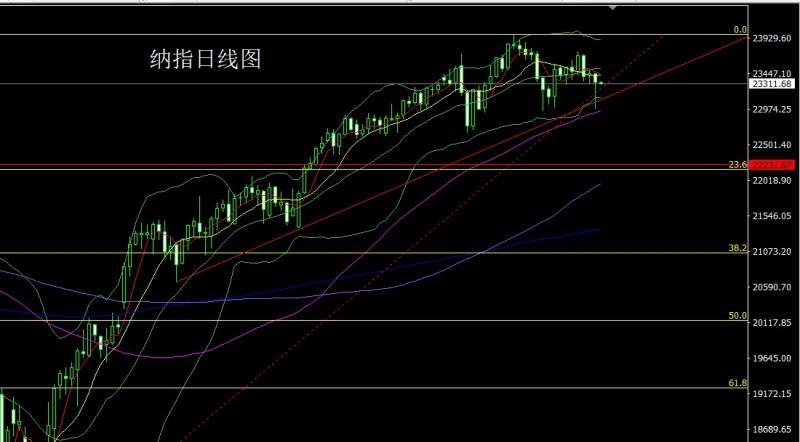
The Nasdaq market opened at 23450.12 yesterday and the market rose slightly. The market fluctuated and fell strongly. The daily line was at the lowest point of 22975.95. Then the market rose strongly at the end of the trading session. The daily line finally closed at 23330.37. After the daily line ended with a hammer head with a very long lower shadow line. After this pattern ended, the stop loss of 23140 more than 23090 today, with the target of 23300 and 23400 and 23450.
The fundamentals, yesterday's fundamentals. The US President said that he would hold an emergency meeting on the tariff ruling on Wednesday. An appeal to the Supreme Court as soon as Wednesday will be filed, and if the tariff appeal is dismissed, the tariff will have to be withdrawn. If the tariff ruling is unfavorable, trillions of dollars will have to be refunded. The Supreme Court will be urged to speed up the ruling. This also shows that if this happens, the United States will face a greater crisis, so the remarks of the US president are equivalent to forcing the US Supreme Issuance Court to release its policies, while Argentina's sovereign debt and foreign exchange fell sharply. The Ministry of Finance announced its involvement in the foreign exchange market. Also in the early morningThe rising gold price trend, today's fundamentals focus mainly on the grand military parade held at 9:00 am. European Central Bank President Lagarde delivered a speech at 15:00 pm. At night, the Bank of England monetary policy makers attended the parliamentary hearing at 21:15. Look at the 22:00 US July JOLTs job openings and US July factory order monthly rates. Tomorrow tomorrow morning, the Federal Reserve will announce the Beige Book of Economic Conditions.
In terms of operation, gold: the long 3325 and 3322 below and the long 3377 and 3385 last week's long position was followed by 3420, 3512 long 3509 long stop loss 3505, the target is 3532 and 3541, the break is 3550 and 3562-3573.
Silver: the long 37.8 below and the long 38.8 last Friday's long position was followed by 39.5, the stop loss was followed by 40.3 yesterday's long position was 40.3, and the stop loss was 40.3 today's 40.5 long stop loss 40.3. The target is 41 and 41.2 and 41.5-41.7.
European and American: Today's short stop loss of 1.16800 is 1.17000, the target below is 1.16400 and 1.16100, if it falls below, it looks at 1.15800 and 1.15600.
U.S. crude oil: 65.4 long stop loss of 64.9 today, the target is 66 and 66.5 and 67-67.5.
Nasdaq: 23140 long stop loss of 23090 today, the target is 23300 and 23400 and 23450.
The above content is all about "[XM Forex Official Website]: Big yellow croaker jumps over the dragon gate, gold and silver breaks the level and continues to be long", which is carefully www.xmniubi.compiled and edited by the editor of XM Forex. I hope it will be helpful to your trading! Thanks for the support!
After doing something, there will always be experience and lessons. In order to facilitate future work, we must analyze, study, summarize and concentrate the experience and lessons of previous work, and raise it to the theoretical level to understand it.
Disclaimers: XM Group only provides execution services and access permissions for online trading platforms, and allows individuals to view and/or use the website or the content provided on the website, but has no intention of making any changes or extensions, nor will it change or extend its services and access permissions. All access and usage permissions will be subject to the following terms and conditions: (i) Terms and conditions; (ii) Risk warning; And (iii) a complete disclaimer. Please note that all information provided on the website is for general informational purposes only. In addition, the content of all XM online trading platforms does not constitute, and cannot be used for any unauthorized financial market trading invitations and/or invitations. Financial market transactions pose significant risks to your investment capital.
All materials published on online trading platforms are only intended for educational/informational purposes and do not include or should be considered for financial, investment tax, or trading related consulting and advice, or transaction price records, or any financial product or non invitation related trading offers or invitations.
All content provided by XM and third-party suppliers on this website, including opinions, news, research, analysis, prices, other information, and third-party website links, remains unchanged and is provided as general market commentary rather than investment advice. All materials published on online trading platforms are only for educational/informational purposes and do not include or should be considered as applicable to financial, investment tax, or trading related advice and recommendations, or transaction price records, or any financial product or non invitation related financial offers or invitations. Please ensure that you have read and fully understood the information on XM's non independent investment research tips and risk warnings. For more details, please click here