


Trusted by over 15 Million Traders
The Most Awarded Broker
for a Reason
Easy Access to 1,400+ Global Assets
EURUSD
Euro vs U.S. Dollar
US500
S&P 500 (US500)
GOLD
Gold
COFFEE
US Coffee
Apple
Apple (AAPL.OQ)
-

Finance Magnates 颁发
-

Finance Magnates 颁发
-

Capital Finance International Magazine (CFI.co) 2024年颁赠
-

COLWMA 2024年颁赠
-

荣获World Finance Forex Awards 2023最佳外汇客户服务奖
-

荣获World Finance Forex Awards 2023欧洲最佳外汇经纪商奖
-

荣获World Finance Forex Awards 2023澳大拉西亚最佳外汇经纪商奖
-

荣获World Finance Forex Awards 2023拉丁美洲最佳外汇经纪商奖
-

荣获World Finance Forex Awards 2023中东最佳外汇经纪商奖
-

CFI.co于2023年颁赠
-

荣获2023年City of London Wealth Management Awards
-

荣获2022年埃及金融博览会颁赠
-

荣获2022年City of London Wealth Management Awards
-

CFI.co于2022年颁赠
-

荣获Global Forex Awards 2022 — 零售外汇 颁赠
-
2021年迪拜外汇博览会获颁赠
-

Ultimate Fintech 2021年颁赠
-

荣获2021年City of London Wealth Management Awards
-

FX168于2020年12月颁赠
-

荣获Global Business Awards 2020
-

荣获2020年City of London Wealth Management Awards
-

Capital Finance International Magazine (CFI.co)颁赠
-

Capital Finance International Magazine (CFI.co)颁赠
-

荣获2019年City of London Wealth Management Awards
-

Shares Magazine 授予 UK Forex Awards 2018
-

Capital Finance International Magazine (CFI.co)颁赠
-

Capital Finance International Magazine (CFI.co)颁赠
-

2017年伦敦财富管理奖
-

2016最佳本土 客户服务
-

中东和北非地区(MENA)增长最快的经纪商
-
2015年最佳外汇科技提供商
-
2014年最佳外汇科技提供商
-

2014年最佳外汇科技提供商
-

荣获 The Trading Show 2024年非洲 Africa Fintech 峰会颁赠
-

荣获2024年中东地区 Brokersview 颁赠
-
荣获2024年中东地区 Brokersview 颁赠
-

荣获2024年阿曼 Smart Vision 峰会颁赠
-

荣获2024年迪拜外汇博览会颁赠
-

荣获2024年迪拜 Forex Traders Summit 颁赠
-

2024年埃及 Smart Vision 峰会颁赠
-

投查查于2024年颁赠
-

Capital Finance International Magazine (CFI.co) 2024年颁赠
-

CFI.co于2023年颁赠
-

CFI.co于2023年颁赠
-

交易社区平台FOLLOWME于2022年颁赠
-
2022年迪拜Forex Expo获颁赠
-
2022年迪拜Forex Expo获颁赠
-

荣获Global Forex Awards 2022 — 零售外汇 颁赠
-

CFI.co于2022年颁赠
-

CFI.co于2022年颁赠
-

World Finance Forex Awards 2022 颁发
-

World Finance Forex Awards 2022 颁发
-

World Finance Forex Awards 2022 颁发
-

World Finance Forex Awards 2022 颁发
-
交易社区平台FOLLOWME于2021年颁赠
-

2021年埃及Smart Vision Investment Expo博览会获颁赠
-

CFI.co于2021年颁赠
-

CFI.co于2021年颁赠
-

荣获Global Forex Awards 2021 — 零售外汇 颁赠
-

荣获Global Forex Awards 2021 — 零售外汇 颁赠
-

World Finance 2021颁发
-

World Finance 2021颁发
-
FOLLOWME于2021年颁赠
-

Global Forex Awards 2021 — B2B 颁赠
-

Global Forex Awards颁赠
-

Global Forex Awards颁赠
-

CFI.co于2020年颁赠
-

CFI.co于2020年颁赠
-

荣获Global Business Awards 2020
-

World Finance Magazine 颁赠
World Finance Forex Awards 2020 -

World Finance Magazine 颁赠
World Finance Forex Awards 2020 -
FOLLOWME交易社区授予
-

Global Forex Awards颁赠
-

Global Forex Awards颁赠
-

FinTech Age Awards颁发
-

World Finance Magazine 颁赠
World Finance Forex Awards 2019 -

World Finance Magazine 颁赠
World Finance Forex Awards 2019 -

荣获 World Finance Forex Awards 2018 颁赠
-

荣获2018年埃及金融博览会颁赠
-

荣获 Shares Magazine 的 UK Forex Awards 2017 颁赠
-

荣获 World Finance Forex Awards 2017
-

2016年最佳黄金经纪商
-

2016年最佳外汇经纪商
-

2015年最佳本地客户服务
-

Global Brands Magazine 颁赠
-

Online Money Awards 2022 颁发
-

荣获2022年埃及金融博览会颁赠
-

2015最佳外汇交易平台
-

2015最佳金融交易平台
-

2013最佳创新外汇平台奖
-

2020年 Cyprus HR Awards 颁赠
-

金融行业的佼佼者
-

认证最优金牌级别
-

2014年首届亚军
-
Finance Magnates 颁发
-
Finance Magnates 颁发
-
Capital Finance International Magazine (CFI.co) 2024年颁赠
-
COLWMA 2024年颁赠
-
荣获World Finance Forex Awards 2023最佳外汇客户服务奖
-
荣获World Finance Forex Awards 2023欧洲最佳外汇经纪商奖
-
荣获World Finance Forex Awards 2023澳大拉西亚最佳外汇经纪商奖
-
荣获World Finance Forex Awards 2023拉丁美洲最佳外汇经纪商奖
-
荣获World Finance Forex Awards 2023中东最佳外汇经纪商奖
-
CFI.co于2023年颁赠
-
荣获2023年City of London Wealth Management Awards
-
荣获2022年埃及金融博览会颁赠
-
荣获2022年City of London Wealth Management Awards
-
CFI.co于2022年颁赠
-
荣获Global Forex Awards 2022 — 零售外汇 颁赠
-
2021年迪拜外汇博览会获颁赠
-
Ultimate Fintech 2021年颁赠
-
荣获2021年City of London Wealth Management Awards
-
FX168于2020年12月颁赠
-
荣获Global Business Awards 2020
-
荣获2020年City of London Wealth Management Awards
-
Capital Finance International Magazine (CFI.co)颁赠
-
Capital Finance International Magazine (CFI.co)颁赠
-
荣获2019年City of London Wealth Management Awards
-
Shares Magazine 授予 UK Forex Awards 2018
-
Capital Finance International Magazine (CFI.co)颁赠
-
Capital Finance International Magazine (CFI.co)颁赠
-
2017年伦敦财富管理奖
-
2016最佳本土 客户服务
-
中东和北非地区(MENA)增长最快的经纪商
-
2015年最佳外汇科技提供商
-
2014年最佳外汇科技提供商
-
2014年最佳外汇科技提供商
-
荣获 The Trading Show 2024年非洲 Africa Fintech 峰会颁赠
-
荣获2024年中东地区 Brokersview 颁赠
-
荣获2024年中东地区 Brokersview 颁赠
-
荣获2024年阿曼 Smart Vision 峰会颁赠
-
荣获2024年迪拜外汇博览会颁赠
-
荣获2024年迪拜 Forex Traders Summit 颁赠
-
2024年埃及 Smart Vision 峰会颁赠
-
投查查于2024年颁赠
-
Capital Finance International Magazine (CFI.co) 2024年颁赠
-
CFI.co于2023年颁赠
-
CFI.co于2023年颁赠
-
交易社区平台FOLLOWME于2022年颁赠
-
2022年迪拜Forex Expo获颁赠
-
2022年迪拜Forex Expo获颁赠
-
荣获Global Forex Awards 2022 — 零售外汇 颁赠
-
CFI.co于2022年颁赠
-
CFI.co于2022年颁赠
-
World Finance Forex Awards 2022 颁发
-
World Finance Forex Awards 2022 颁发
-
World Finance Forex Awards 2022 颁发
-
World Finance Forex Awards 2022 颁发
-
交易社区平台FOLLOWME于2021年颁赠
-
2021年埃及Smart Vision Investment Expo博览会获颁赠
-
CFI.co于2021年颁赠
-
CFI.co于2021年颁赠
-
荣获Global Forex Awards 2021 — 零售外汇 颁赠
-
荣获Global Forex Awards 2021 — 零售外汇 颁赠
-
World Finance 2021颁发
-
World Finance 2021颁发
-
FOLLOWME于2021年颁赠
-
Global Forex Awards 2021 — B2B 颁赠
-
Global Forex Awards颁赠
-
Global Forex Awards颁赠
-
CFI.co于2020年颁赠
-
CFI.co于2020年颁赠
-
荣获Global Business Awards 2020
-
World Finance Magazine 颁赠
World Finance Forex Awards 2020 -
World Finance Magazine 颁赠
World Finance Forex Awards 2020 -
FOLLOWME交易社区授予
-
Global Forex Awards颁赠
-
Global Forex Awards颁赠
-
FinTech Age Awards颁发
-
World Finance Magazine 颁赠
World Finance Forex Awards 2019 -
World Finance Magazine 颁赠
World Finance Forex Awards 2019 -
荣获 World Finance Forex Awards 2018 颁赠
-
荣获2018年埃及金融博览会颁赠
-
荣获 Shares Magazine 的 UK Forex Awards 2017 颁赠
-
荣获 World Finance Forex Awards 2017
-
2016年最佳黄金经纪商
-
2016年最佳外汇经纪商
-
2015年最佳本地客户服务
-
Global Brands Magazine 颁赠
-
Online Money Awards 2022 颁发
-
荣获2022年埃及金融博览会颁赠
-
2015最佳外汇交易平台
-
2015最佳金融交易平台
-
2013最佳创新外汇平台奖
-
2020年 Cyprus HR Awards 颁赠
-
金融行业的佼佼者
-
认证最优金牌级别
-
2014年首届亚军

Awarded BestBrokerYear After Year
CATEGORIES
News
- 【XM Decision Analysis】--USD/ILS Analysis: Solid Range Creating Testing Ground fo
- 【XM Forex】--GBP/USD Forex Signal: Uptrend Loses Momentum Ahead of Fed Decision
- 【XM Group】--EUR/USD Forex Signal: Weakly Bullish Above $1.0338
- 【XM Market Review】--Gold Forecast: Stabilizes Near 50-Day EMA
- 【XM Market Review】--WTI Crude Oil Weekly Forecast: Known Range with More Holiday
market analysis
After gold hits a new high, 3466 gains and losses determine short-term strength and weakness, Europe and the United States pay attention to the rhythm
Wonderful Introduction:
A quiet path will always arouse a relaxed yearning in twists and turns; a huge wave, the thrilling sound can be even more stacked when the tide rises and falls; a story, only with regrets and sorrows can bring about a heart-wrenching desolation; a life, where the ups and downs show the stunning heroism.
Hello everyone, today XM Foreign Exchange will bring you "[XM Foreign Exchange Decision Analysis]: After gold hits a new high, the gains and losses determine the short-term strength and weakness, and Europe and the United States pay attention to the rhythm." Hope it will be helpful to you! The original content is as follows:
Dollar Index
In terms of the performance of the US dollar index, the US dollar index showed a downward trend on Monday. The price of the US dollar index rose to 97.849 on the day, and fell to 97.509 on the lowest, and finally closed at 97.658. Looking back at the market performance on Monday, the price fell again after a short-term fluctuation in the early trading period. The price stopped after the European session and corrected upwardly. From the final closing, the price still ended with a big negative end. In response to the recent continued fluctuation of the US index, the gains and losses of the daily and weekly resistance in the future are still the key to the US index.
From a multi-cycle analysis, the price has been consolidating up and down in the weekly level recently. Currently, the weekly resistance is in the 98 area. The gains and losses of this position determine the subsequent performance. At this point, the reason why it is still short-term under this position. From the daily level, we need to pay attention to the resistance in the 98.10 area for the time being, and the price is short below this position. From the four-hour level, the four-hour resistance is currently in the 97.75 area over time, and the price pierces upward in the short term, so there is an upward test of the daily and weekly resistance areas in the four-hour period. We are cautious in chasing short positions for the time being, and we will pay attention to the gains and losses of the daily and weekly resistance areas in the future.
The US dollar index has a long range of 97.70-80, with a defense of 5 US dollars, and a target of 98-98.10
Gold
In terms of gold, the overall price of gold showed an upward trend on Monday. The price rose to the highest level on the day and fell to the lowest level at 3489.7, closingDisk at 3476.03. In response to the price of gold still bottomed out and rebounded during the early trading session on Monday, and then it strongly broke through the previous day's high point. Due to yesterday's holiday factors, the US market still ended with a big sun. At the same time, the early trading session of Tuesday today broke through the historical high, and the subsequent gains and losses of 3466 determine whether the bulls can continue. From a multi-cycle analysis, first observe the monthly rhythm. The monthly price ended in August. Overall, the price is still running bullishly. From the long-term perspective, the 3000 position is the watershed of the long-term trend. The price can be treated more on the long-term. From the weekly level, the price has broken through key resistance after recent continuous fluctuations and has now hit a new historical high. Currently, the weekly long and short watershed is at 3370. The price is above this position and the medium line is treated more. From the daily level, we need to pay attention to the 3385 regional support for the time being, and the band above this position should be treated more often. From the four-hour perspective, we need to pay attention to the 3366 regional watershed for the time being. The price will still be treated more frequently in the short term. Only after the subsequent break of this position will it be adjusted. At the same time, from the one-hour perspective, the price maintains a strong rise. If the price wants to be strong, the early trading low of 3474 will become the key. If it does not break this position, it is more strong. Once it breaks down, you need to pay attention to whether the four-hour watershed can obtain support again. So at present, before breaking the four-hour watershed, it is still treated more often, and then turn around after breaking down.
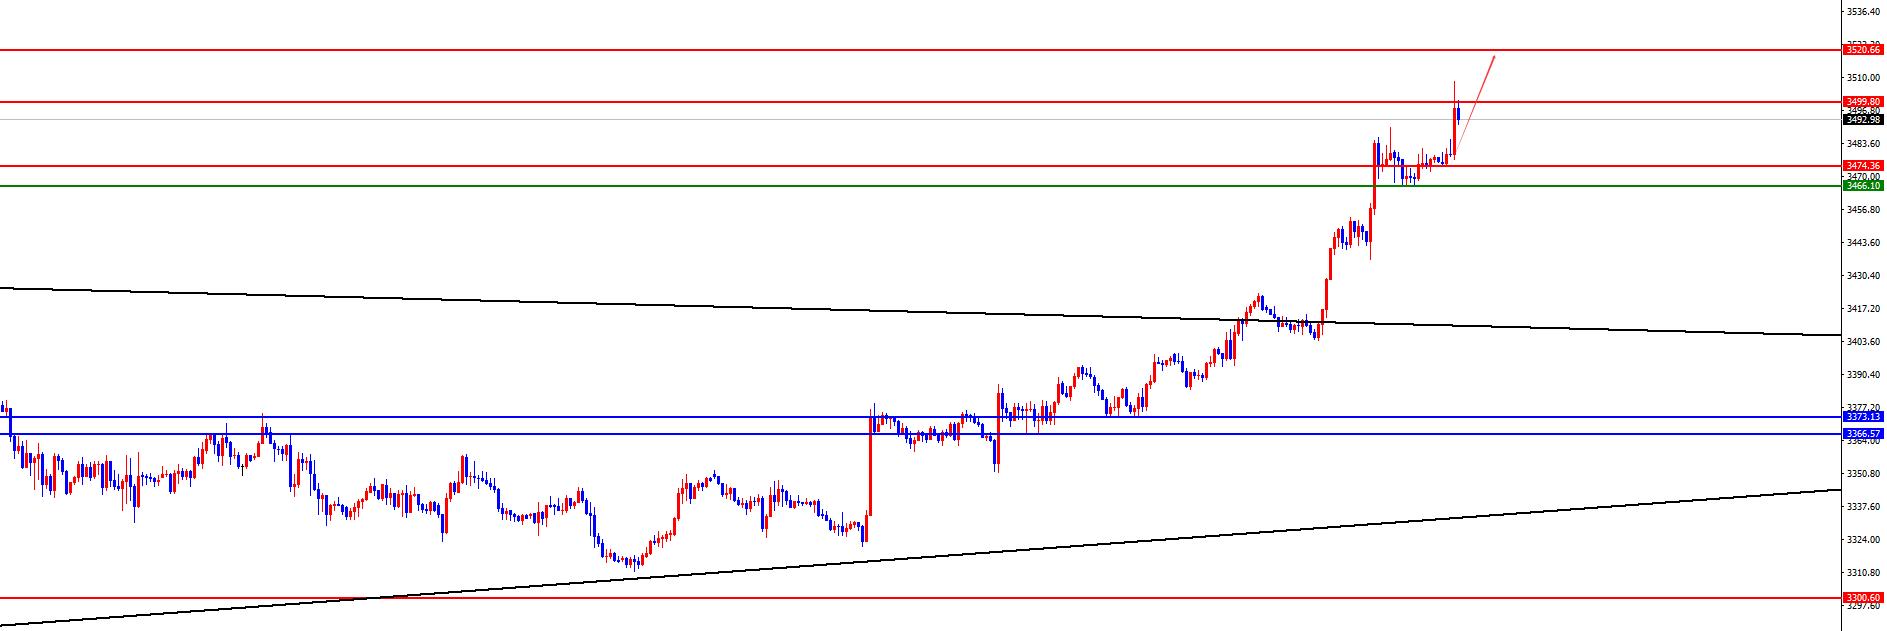
Gold 3366-3374 is a long-shoulder watershed, and the price remains long in this area
European and the United States
European and the United States
European and the United States
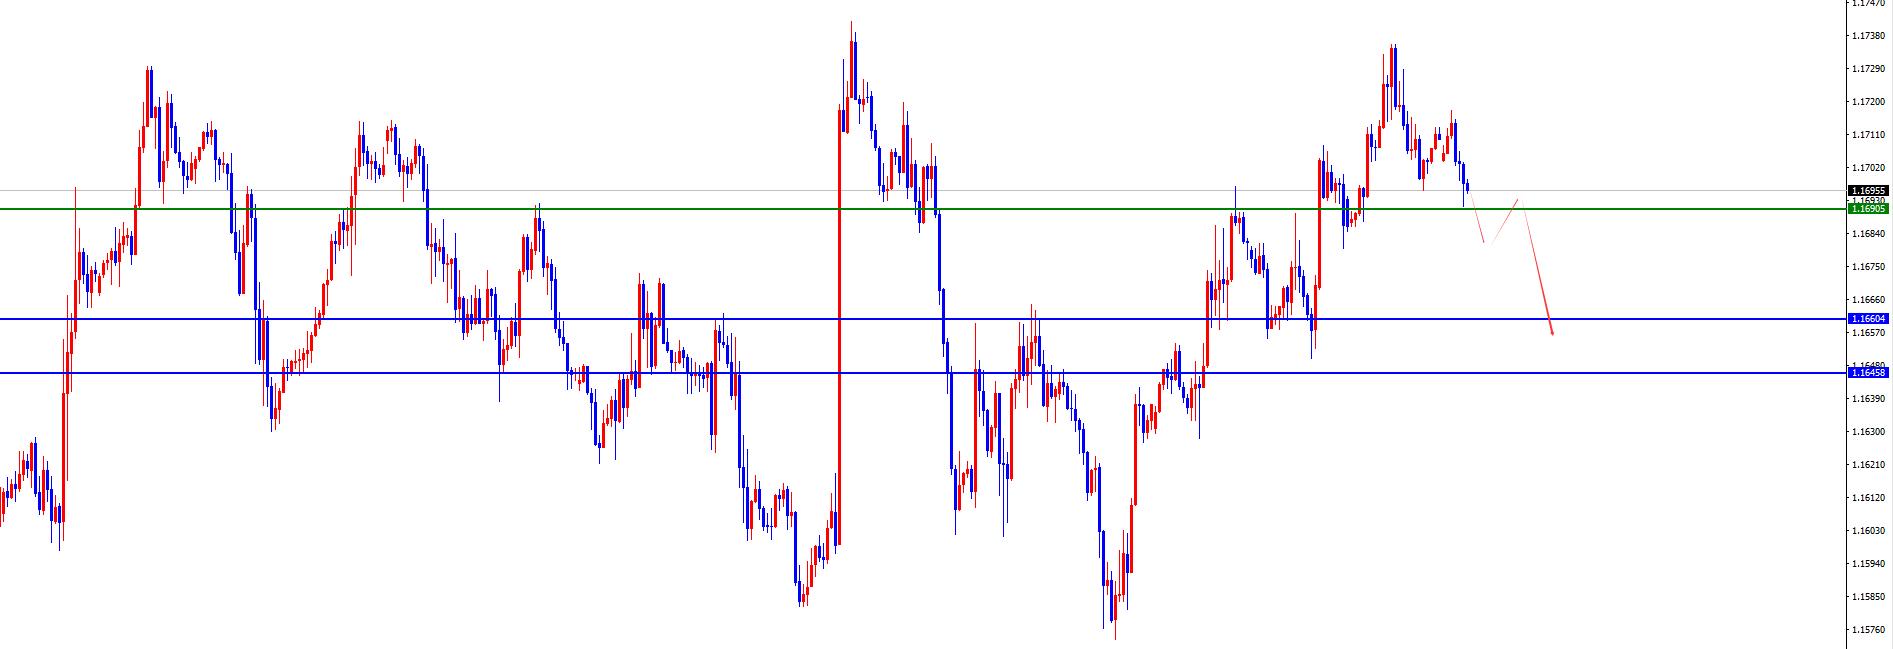
European and the United States generally showed an upward trend on Monday. The price fell to 1.1684 on the day and rose to 1.1736 on the spot and closed at 1.1710 on the spot. Looking back at the performance of European and American markets on Monday, prices rose again after a short-term fluctuation in the early trading session. Prices continued to fluctuate after the European trading session and did not continue. Prices fell weakly after the US trading session. In the end, the positive line ended on the same day. For the current short-term European and American markets, we need to pay attention to the gains and losses of four-hour support. From a multi-cycle analysis, from the monthly level, Europe and the United States are supported by 1.1060, so the price is long-term bullish above this position. From the weekly level, the price is supported by the 1.1645 area, which is the long-shoulder watershed in the mid-line trend. From the daily level, the daily line is currently supported at the 1.1660 position over time. This position is a key watershed in the band trend, and the price is more treated with bands above this position. From the four-hour level, the current price is supported at 1.1690 for four hours, and the price has further pressure in the short term, so the bulls are cautious for the time being, focusing on the gains and losses of the four-hour support, and after a second rebound, they will be under pressure. The price is also under pressure on one hour, so the focus is on the gains and losses of four-hour support.

Europe and the United States fell below 1.1690 and rebounded short, with a target of 1.11.1660-1.1645
[Finance data and events that are focused today] Tuesday, September 2, 2025
①17:00 Eurozone August CPI annual rate initial value
②17:00 Eurozone August CPI monthly rate initial value
③21:45 US August S&P Global Manufacturing PMI final value
④22:00 US August ISM Manufacturing PMI
⑤22:00 US July construction Monthly Expenditure Rate
Note: The above is only personal opinion and strategy, for review and www.xmniubi.communication only, and does not give customers any investment advice. It has nothing to do with customers' investment, and it is not used as a basis for placing an order.
The above content is all about "[XM Foreign Exchange Decision Analysis]: After gold hits a new high, 3466 gains and losses determine short-term strength, Europe and the United States pay attention to the rhythm". It was carefully www.xmniubi.compiled and edited by the editor of XM Foreign Exchange. I hope it will be helpful to your trading! Thank you for your support!
Every successful person has a start. Only by being brave enough to start can you find the way to success. Read the next article quickly!
Disclaimers: XM Group only provides execution services and access permissions for online trading platforms, and allows individuals to view and/or use the website or the content provided on the website, but has no intention of making any changes or extensions, nor will it change or extend its services and access permissions. All access and usage permissions will be subject to the following terms and conditions: (i) Terms and conditions; (ii) Risk warning; And (iii) a complete disclaimer. Please note that all information provided on the website is for general informational purposes only. In addition, the content of all XM online trading platforms does not constitute, and cannot be used for any unauthorized financial market trading invitations and/or invitations. Financial market transactions pose significant risks to your investment capital.
All materials published on online trading platforms are only intended for educational/informational purposes and do not include or should be considered for financial, investment tax, or trading related consulting and advice, or transaction price records, or any financial product or non invitation related trading offers or invitations.
All content provided by XM and third-party suppliers on this website, including opinions, news, research, analysis, prices, other information, and third-party website links, remains unchanged and is provided as general market commentary rather than investment advice. All materials published on online trading platforms are only for educational/informational purposes and do not include or should be considered as applicable to financial, investment tax, or trading related advice and recommendations, or transaction price records, or any financial product or non invitation related financial offers or invitations. Please ensure that you have read and fully understood the information on XM's non independent investment research tips and risk warnings. For more details, please click here