


Trusted by over 15 Million Traders
The Most Awarded Broker
for a Reason
Easy Access to 1,400+ Global Assets
EURUSD
Euro vs U.S. Dollar
US500
S&P 500 (US500)
GOLD
Gold
COFFEE
US Coffee
Apple
Apple (AAPL.OQ)
-

Finance Magnates 颁发
-

Finance Magnates 颁发
-

Capital Finance International Magazine (CFI.co) 2024年颁赠
-

COLWMA 2024年颁赠
-

荣获World Finance Forex Awards 2023最佳外汇客户服务奖
-

荣获World Finance Forex Awards 2023欧洲最佳外汇经纪商奖
-

荣获World Finance Forex Awards 2023澳大拉西亚最佳外汇经纪商奖
-

荣获World Finance Forex Awards 2023拉丁美洲最佳外汇经纪商奖
-

荣获World Finance Forex Awards 2023中东最佳外汇经纪商奖
-

CFI.co于2023年颁赠
-

荣获2023年City of London Wealth Management Awards
-

荣获2022年埃及金融博览会颁赠
-

荣获2022年City of London Wealth Management Awards
-

CFI.co于2022年颁赠
-

荣获Global Forex Awards 2022 — 零售外汇 颁赠
-
2021年迪拜外汇博览会获颁赠
-

Ultimate Fintech 2021年颁赠
-

荣获2021年City of London Wealth Management Awards
-

FX168于2020年12月颁赠
-

荣获Global Business Awards 2020
-

荣获2020年City of London Wealth Management Awards
-

Capital Finance International Magazine (CFI.co)颁赠
-

Capital Finance International Magazine (CFI.co)颁赠
-

荣获2019年City of London Wealth Management Awards
-

Shares Magazine 授予 UK Forex Awards 2018
-

Capital Finance International Magazine (CFI.co)颁赠
-

Capital Finance International Magazine (CFI.co)颁赠
-

2017年伦敦财富管理奖
-

2016最佳本土 客户服务
-

中东和北非地区(MENA)增长最快的经纪商
-
2015年最佳外汇科技提供商
-
2014年最佳外汇科技提供商
-

2014年最佳外汇科技提供商
-

荣获 The Trading Show 2024年非洲 Africa Fintech 峰会颁赠
-

荣获2024年中东地区 Brokersview 颁赠
-
荣获2024年中东地区 Brokersview 颁赠
-

荣获2024年阿曼 Smart Vision 峰会颁赠
-

荣获2024年迪拜外汇博览会颁赠
-

荣获2024年迪拜 Forex Traders Summit 颁赠
-

2024年埃及 Smart Vision 峰会颁赠
-

投查查于2024年颁赠
-

Capital Finance International Magazine (CFI.co) 2024年颁赠
-

CFI.co于2023年颁赠
-

CFI.co于2023年颁赠
-

交易社区平台FOLLOWME于2022年颁赠
-
2022年迪拜Forex Expo获颁赠
-
2022年迪拜Forex Expo获颁赠
-

荣获Global Forex Awards 2022 — 零售外汇 颁赠
-

CFI.co于2022年颁赠
-

CFI.co于2022年颁赠
-

World Finance Forex Awards 2022 颁发
-

World Finance Forex Awards 2022 颁发
-

World Finance Forex Awards 2022 颁发
-

World Finance Forex Awards 2022 颁发
-
交易社区平台FOLLOWME于2021年颁赠
-

2021年埃及Smart Vision Investment Expo博览会获颁赠
-

CFI.co于2021年颁赠
-

CFI.co于2021年颁赠
-

荣获Global Forex Awards 2021 — 零售外汇 颁赠
-

荣获Global Forex Awards 2021 — 零售外汇 颁赠
-

World Finance 2021颁发
-

World Finance 2021颁发
-
FOLLOWME于2021年颁赠
-

Global Forex Awards 2021 — B2B 颁赠
-

Global Forex Awards颁赠
-

Global Forex Awards颁赠
-

CFI.co于2020年颁赠
-

CFI.co于2020年颁赠
-

荣获Global Business Awards 2020
-

World Finance Magazine 颁赠
World Finance Forex Awards 2020 -

World Finance Magazine 颁赠
World Finance Forex Awards 2020 -
FOLLOWME交易社区授予
-

Global Forex Awards颁赠
-

Global Forex Awards颁赠
-

FinTech Age Awards颁发
-

World Finance Magazine 颁赠
World Finance Forex Awards 2019 -

World Finance Magazine 颁赠
World Finance Forex Awards 2019 -

荣获 World Finance Forex Awards 2018 颁赠
-

荣获2018年埃及金融博览会颁赠
-

荣获 Shares Magazine 的 UK Forex Awards 2017 颁赠
-

荣获 World Finance Forex Awards 2017
-

2016年最佳黄金经纪商
-

2016年最佳外汇经纪商
-

2015年最佳本地客户服务
-

Global Brands Magazine 颁赠
-

Online Money Awards 2022 颁发
-

荣获2022年埃及金融博览会颁赠
-

2015最佳外汇交易平台
-

2015最佳金融交易平台
-

2013最佳创新外汇平台奖
-

2020年 Cyprus HR Awards 颁赠
-

金融行业的佼佼者
-

认证最优金牌级别
-

2014年首届亚军
-
Finance Magnates 颁发
-
Finance Magnates 颁发
-
Capital Finance International Magazine (CFI.co) 2024年颁赠
-
COLWMA 2024年颁赠
-
荣获World Finance Forex Awards 2023最佳外汇客户服务奖
-
荣获World Finance Forex Awards 2023欧洲最佳外汇经纪商奖
-
荣获World Finance Forex Awards 2023澳大拉西亚最佳外汇经纪商奖
-
荣获World Finance Forex Awards 2023拉丁美洲最佳外汇经纪商奖
-
荣获World Finance Forex Awards 2023中东最佳外汇经纪商奖
-
CFI.co于2023年颁赠
-
荣获2023年City of London Wealth Management Awards
-
荣获2022年埃及金融博览会颁赠
-
荣获2022年City of London Wealth Management Awards
-
CFI.co于2022年颁赠
-
荣获Global Forex Awards 2022 — 零售外汇 颁赠
-
2021年迪拜外汇博览会获颁赠
-
Ultimate Fintech 2021年颁赠
-
荣获2021年City of London Wealth Management Awards
-
FX168于2020年12月颁赠
-
荣获Global Business Awards 2020
-
荣获2020年City of London Wealth Management Awards
-
Capital Finance International Magazine (CFI.co)颁赠
-
Capital Finance International Magazine (CFI.co)颁赠
-
荣获2019年City of London Wealth Management Awards
-
Shares Magazine 授予 UK Forex Awards 2018
-
Capital Finance International Magazine (CFI.co)颁赠
-
Capital Finance International Magazine (CFI.co)颁赠
-
2017年伦敦财富管理奖
-
2016最佳本土 客户服务
-
中东和北非地区(MENA)增长最快的经纪商
-
2015年最佳外汇科技提供商
-
2014年最佳外汇科技提供商
-
2014年最佳外汇科技提供商
-
荣获 The Trading Show 2024年非洲 Africa Fintech 峰会颁赠
-
荣获2024年中东地区 Brokersview 颁赠
-
荣获2024年中东地区 Brokersview 颁赠
-
荣获2024年阿曼 Smart Vision 峰会颁赠
-
荣获2024年迪拜外汇博览会颁赠
-
荣获2024年迪拜 Forex Traders Summit 颁赠
-
2024年埃及 Smart Vision 峰会颁赠
-
投查查于2024年颁赠
-
Capital Finance International Magazine (CFI.co) 2024年颁赠
-
CFI.co于2023年颁赠
-
CFI.co于2023年颁赠
-
交易社区平台FOLLOWME于2022年颁赠
-
2022年迪拜Forex Expo获颁赠
-
2022年迪拜Forex Expo获颁赠
-
荣获Global Forex Awards 2022 — 零售外汇 颁赠
-
CFI.co于2022年颁赠
-
CFI.co于2022年颁赠
-
World Finance Forex Awards 2022 颁发
-
World Finance Forex Awards 2022 颁发
-
World Finance Forex Awards 2022 颁发
-
World Finance Forex Awards 2022 颁发
-
交易社区平台FOLLOWME于2021年颁赠
-
2021年埃及Smart Vision Investment Expo博览会获颁赠
-
CFI.co于2021年颁赠
-
CFI.co于2021年颁赠
-
荣获Global Forex Awards 2021 — 零售外汇 颁赠
-
荣获Global Forex Awards 2021 — 零售外汇 颁赠
-
World Finance 2021颁发
-
World Finance 2021颁发
-
FOLLOWME于2021年颁赠
-
Global Forex Awards 2021 — B2B 颁赠
-
Global Forex Awards颁赠
-
Global Forex Awards颁赠
-
CFI.co于2020年颁赠
-
CFI.co于2020年颁赠
-
荣获Global Business Awards 2020
-
World Finance Magazine 颁赠
World Finance Forex Awards 2020 -
World Finance Magazine 颁赠
World Finance Forex Awards 2020 -
FOLLOWME交易社区授予
-
Global Forex Awards颁赠
-
Global Forex Awards颁赠
-
FinTech Age Awards颁发
-
World Finance Magazine 颁赠
World Finance Forex Awards 2019 -
World Finance Magazine 颁赠
World Finance Forex Awards 2019 -
荣获 World Finance Forex Awards 2018 颁赠
-
荣获2018年埃及金融博览会颁赠
-
荣获 Shares Magazine 的 UK Forex Awards 2017 颁赠
-
荣获 World Finance Forex Awards 2017
-
2016年最佳黄金经纪商
-
2016年最佳外汇经纪商
-
2015年最佳本地客户服务
-
Global Brands Magazine 颁赠
-
Online Money Awards 2022 颁发
-
荣获2022年埃及金融博览会颁赠
-
2015最佳外汇交易平台
-
2015最佳金融交易平台
-
2013最佳创新外汇平台奖
-
2020年 Cyprus HR Awards 颁赠
-
金融行业的佼佼者
-
认证最优金牌级别
-
2014年首届亚军

Awarded BestBrokerYear After Year
CATEGORIES
News
- 【XM Decision Analysis】--SP&500 Forecast : Rallies After CPI Misses
- 【XM Market Review】--BTC/USD Forecast: Bitcoin Continues to Test Support
- 【XM Market Review】--USD/CAD Forecast: After 50 Basis Point Cut in Ottawa
- 【XM Group】--EUR/USD Analysis: Weakens Below 1.03
- 【XM Market Analysis】--USD/ZAR Forecast: US Dollar Continues to Rally Against Sou
market analysis
The US dollar index is about to break the position, Shanghai copper is long and corn is short
Wonderful introduction:
A clean and honest man is the happiness of honest people, a prosperous business is the happiness of businessmen, a punishment of evil and traitors is the happiness of chivalrous men, a good character and academic performance is the happiness of students, aiding the poor and helping the poor is the happiness of good people, and planting in spring and harvesting in autumn is the happiness of farmers.
Hello everyone, today XM Foreign Exchange will bring you "[XM Foreign Exchange Market Review]: The monthly US index is about to break the level, and Shanghai copper is long and short corn". Hope it will be helpful to you! The original content is as follows:
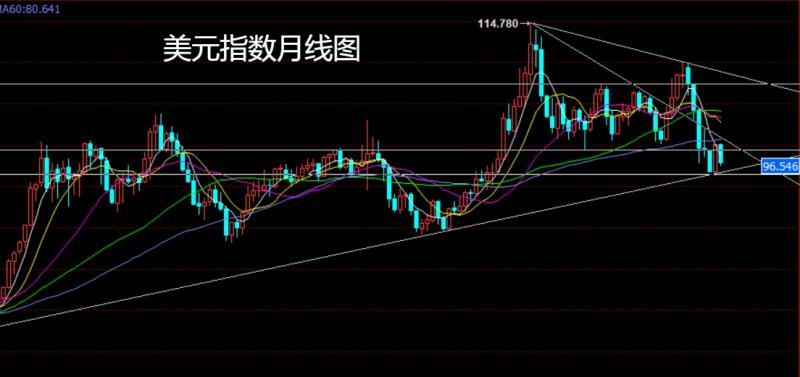
The US dollar index market www.xmniubi.completed the monthly closing line of August last week. Looking back at the market, the market opened at 100.066 at the beginning of the month and then rose first to give the monthly high of 100.187 at the position of 100.187 at the position of 100.548 at the lowest point, and the market consolidated. The monthly line finally closed at 97.832 at the position of 97.832. The market closed with a large negative line with a slightly longer lower shadow line. After the end of this pattern, the US dollar index market in September had a demand for continued decline and breaking support.
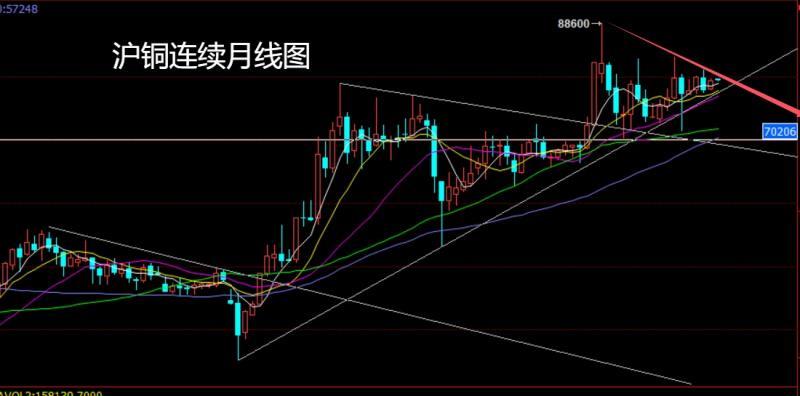
Shanghai copper market opened at the 78150 position in early August and then the market fell slightly. After the market fluctuated and rose. The monthly line reached the highest position of 79860 and then the market consolidated. The line finally closed at the 79650 position. After the monthly line closed with a large positive line with a slightly longer upper shadow line. After this pattern ended, the Shanghai copper market continued to be bullish in September, and September was also the time for the Fed to cut interest rates. At the point, the stop loss of more than 79450 and more than 79200 next week, and the target was 79850 and 80000 and 80350 and 80600.
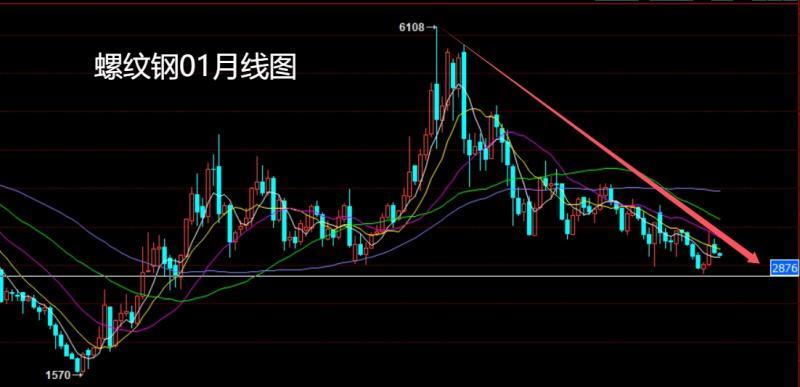
The market of rebar 01 opened at the beginning of August at 3272, and then the market first rose. The monthly high of 3348 was given.After falling, the monthly line is at the lowest point of 3124, the market consolidates. The monthly line finally closes at the 3125 position, and then the monthly line closes with a long upper shadow line. After this pattern ends, the market in September has pressure to fall. At the point, this week, the target of 3145 short stop loss 3160 issuance target 3124, and the price falls below 3100 and 3060 and 3030.
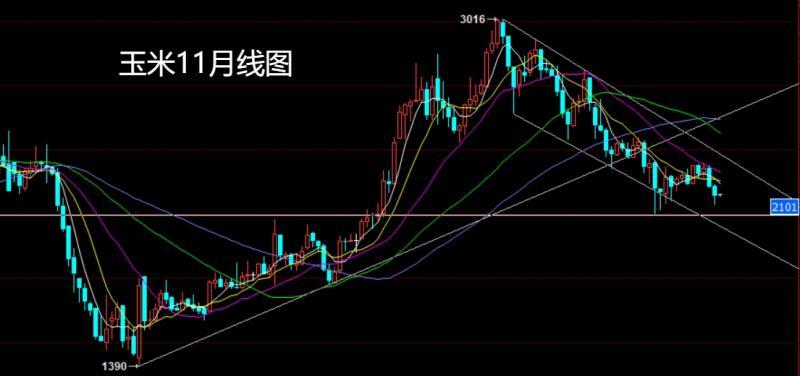
The corn 11 market opened at the 2231 position in early August and then rose first. The market fluctuated strongly and then fell. The monthly line was at the lowest point of 2147 and then the market consolidated. After the monthly line finally closed at the 2192 position, the monthly line closed with a very long lower shadow line. After this pattern ended, corn in September had pressure to adjust. At the point, the 2175 stop loss was 2140 this week, and the target was 2210 and 2230 and 2240.
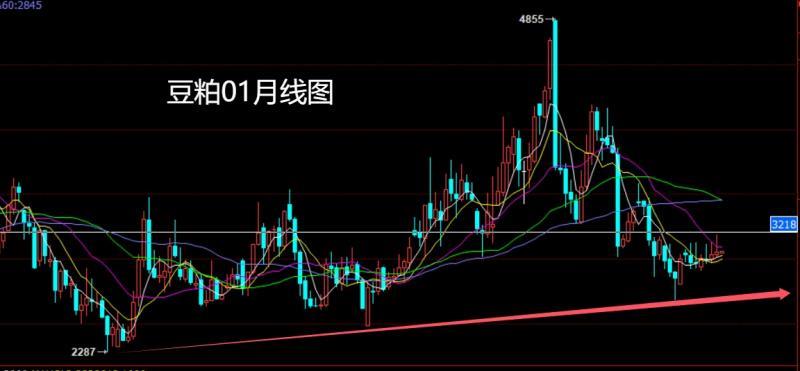
The soybean meal 01 market opened at 3046 in early August and then fell first. The monthly line was at the lowest point of 3024 and then the market fluctuated and rose. The monthly line reached the highest point of 3190 and then fell under pressure. After the monthly line finally closed at 3060, the monthly line closed in a shooting star with an extremely long upper shadow line. After this pattern ended, the short stop loss of 3110 in 3090 this week, and the target below is 3050 and 3020 and 3000.
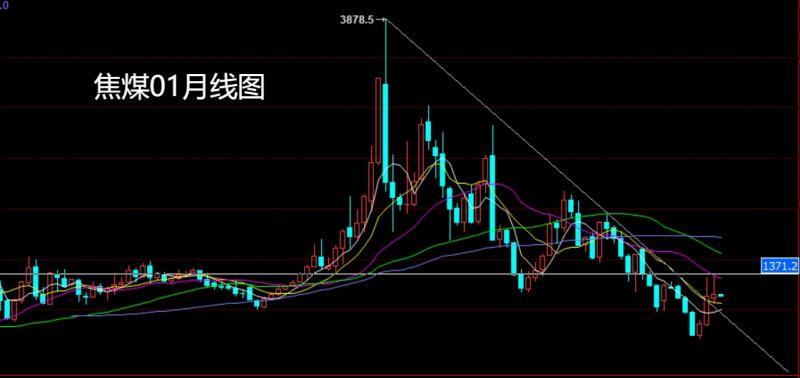
The coking coal 01 market opened at 1121.7 in early August and the market fell first. The monthly line was at the lowest point of 1061.1 and then the market rose strongly. The monthly line reached the highest point of 1328 and then fell strongly. The monthly line finally closed at 1140.5. Then the monthly line closed with an extremely long inverted hammer head pattern with an upper shadow line. After this pattern ended, the short position of 1185 this week and stopped the loss of 1210. The target below is 1135, and the break below is 1100 and 1075.
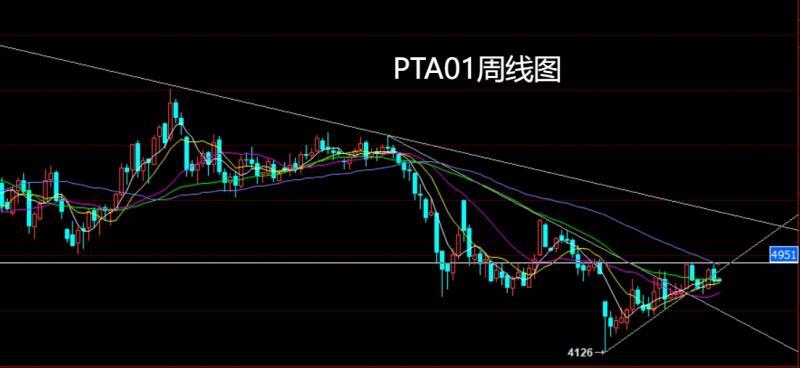
PTA01 market opened at 4879 last week and the market rose and gave a new position of 4923. After the market fell strongly, the weekly line was given the lowest position of 4752. After the market was consolidated, the weekly line finally closed at 4776. After the weekly line closed with a mid-yin line with an upper and lower shadow line, and after this pattern ended, the weekly line was negative and closed, and this week, the weekly line was negative and closed, and this week was negative and closed at 4800 short stop loss of 4825. The target below is 4770 and 4750, and the price below is 4730 and 4700.
BasicIn this regard, the fundamentals of last week's fundamentals were taken against Fed insiders and announced the removal of Fed Director Cook. Cook's lawyers said there is no legal basis for the move, and Cook will not resign and will continue to perform his duties. This is the first time in the Fed's 111-year history that the president fired a director. This incident also turbulent the Federal Reserve's policy and personnel. Data this week showed that the U.S. GDP in the second quarter was revised up from 3% to 3.3%, and net exports contributed nearly 5 percentage points, setting a record high. Total domestic revenue (GDI) soared to 4.8% from 0.2% in the first quarter. Meanwhile, the number of initial jobless claims fell to 229,000 last week, lower than expected, showing labor market resilience. Although www.xmniubi.companies have reduced recruitment, the scale of layoffs is not large. Previously, Powell said that the downside risk of the job market increased. Data on Friday showed that the U.S. PCE price index showed a slight increase in inflation in July, with the core PCE inflation rate reaching 2.9%, the highest since February this year. Despite this, the market still expects the Fed to cut interest rates in September. Consumer spending grew by 0.3%, indicating that the economy has some resilience. However, the widening trade deficit may drag down economic growth in the third quarter. The market focus has turned to the non-agricultural data to be released next week. Gold and silver took advantage of the trend to rise, while the US index fell. The fundamentals of this week are still important, focusing on the final value of the euro zone's August manufacturing PMI at 16:00 on Monday and the final value of the UK's August manufacturing PMI at 16:30 on Monday. The U.S. Labor Day market closed on the same day. On Tuesday, we will pay attention to the initial value of the Eurozone August CPI annual rate at 17:00. At night, we will see the final value of the US S&P Global Manufacturing PMI in August at 21:54, and at night, we will see the final value of the US August ISM Manufacturing PMI in August at 22:00 and the monthly rate of construction expenditure in July at 22:00. On Wednesday, we paid attention to the morning when Tiananmen Square held a grand military parade. European Central Bank President Lagarde delivered a speech at 15:00 pm. At night, the Bank of England monetary policy makers attended the parliamentary hearing at 21:15. Look at the 22:00 US July JOLTs job openings and US July factory order monthly rates. On Thursday, the Federal Reserve announced the Beige Book of Economic Conditions at 2:00 a.m. At night, we will see the number of ADP jobs in the United States in August at 20:15. Look at the number of initial unemployment claims and the U.S. trade accounts for July from 20:30 to the week of August 30. Look at the final value of the US S&P Global Services PMI in August at 21:45 later. Then look at the US August ISM Non-Manufacturing PMI at 22:00. On Friday, we focused on the EIA crude oil inventories from the U.S. to August 29 week and the EIA Cushing crude oil inventories from the U.S. to August 29 week and the EIA strategic oil reserve inventories from the U.S. to August 29 week. At night, we will see the revised annual GDP rate of the euro zone in the second quarter at 17:00 and the final quarterly rate of employment in the euro zone in the second quarter. During the US session, the main focus was on the unemployment rate in August of the United States at 20:30 and the non-farm employment population after the seasonal adjustment in August. This round is expected to be 4.3% and 78,000, while the previous value is 4.2% and 73,000.
In terms of operation, Shanghai Copper has been continuously: more than 79,450 next weekStop loss 79200, target 79850 and 80000 and 80350 and 80600.
Rebar 01: 3145 short stop loss this week 3160 issuing target 3124, falling below 3100 and 3060 and 3030.
Corricane 11: 2175 long stop loss this week 2140, target 2210 and 2230 and 2240.
Soybean meal 01: 3090 short stop loss this week 3110, target below 3050 and 3020 and 3000.
Coking coal 01: Stop loss after short 1185 this week, 1210, look at 1135, and look at 1100 and 1075 to leave the market and backhand long.
PTA01: 4800 short stop loss this week 4825, the target below is 4770 and 4750, and the target below is 4730 and 4700.
The above content is all about "[XM Foreign Exchange Market Review]: The monthly US index is about to break, Shanghai copper is long and short corn" is carefully www.xmniubi.compiled and edited by the editor of XM Foreign Exchange. I hope it will be helpful to your trading! Thanks for the support!
Spring, summer, autumn and winter, every season is a beautiful scenery, and it stays in my heart forever. Leave~~~
Disclaimers: XM Group only provides execution services and access permissions for online trading platforms, and allows individuals to view and/or use the website or the content provided on the website, but has no intention of making any changes or extensions, nor will it change or extend its services and access permissions. All access and usage permissions will be subject to the following terms and conditions: (i) Terms and conditions; (ii) Risk warning; And (iii) a complete disclaimer. Please note that all information provided on the website is for general informational purposes only. In addition, the content of all XM online trading platforms does not constitute, and cannot be used for any unauthorized financial market trading invitations and/or invitations. Financial market transactions pose significant risks to your investment capital.
All materials published on online trading platforms are only intended for educational/informational purposes and do not include or should be considered for financial, investment tax, or trading related consulting and advice, or transaction price records, or any financial product or non invitation related trading offers or invitations.
All content provided by XM and third-party suppliers on this website, including opinions, news, research, analysis, prices, other information, and third-party website links, remains unchanged and is provided as general market commentary rather than investment advice. All materials published on online trading platforms are only for educational/informational purposes and do not include or should be considered as applicable to financial, investment tax, or trading related advice and recommendations, or transaction price records, or any financial product or non invitation related financial offers or invitations. Please ensure that you have read and fully understood the information on XM's non independent investment research tips and risk warnings. For more details, please click here